

Reports & Analytics Real-Time Dashboards That Drive Smarter Decisions
Sales reports, inventory insights, team performance, revenue trends real-time dashboards across every Wortal product. No manual number crunching
Your team spends 2 DAYS MAKING REPORTS every month
that are already outdated


Excel reports take 2 days to prepare
Download data, format, calculate, create charts, make it presentable. By the time it's ready, the data is 5 days old

Decisions based on last month's numbers
This month's strategy is based on last month's report. Market changed, competitors moved, but your data didn't update

Everyone has different numbers
Sales says 50 deals. Manager's sheet says 42. Finance says 38. Nobody agrees because everyone has a different Excel file

No drill-down capability
Report says 'sales dropped 20%'. But why? Which product? Which rep? Which region? Excel can't answer follow-up questions
REPORTING That Works the Way You Do
Open Dashboard
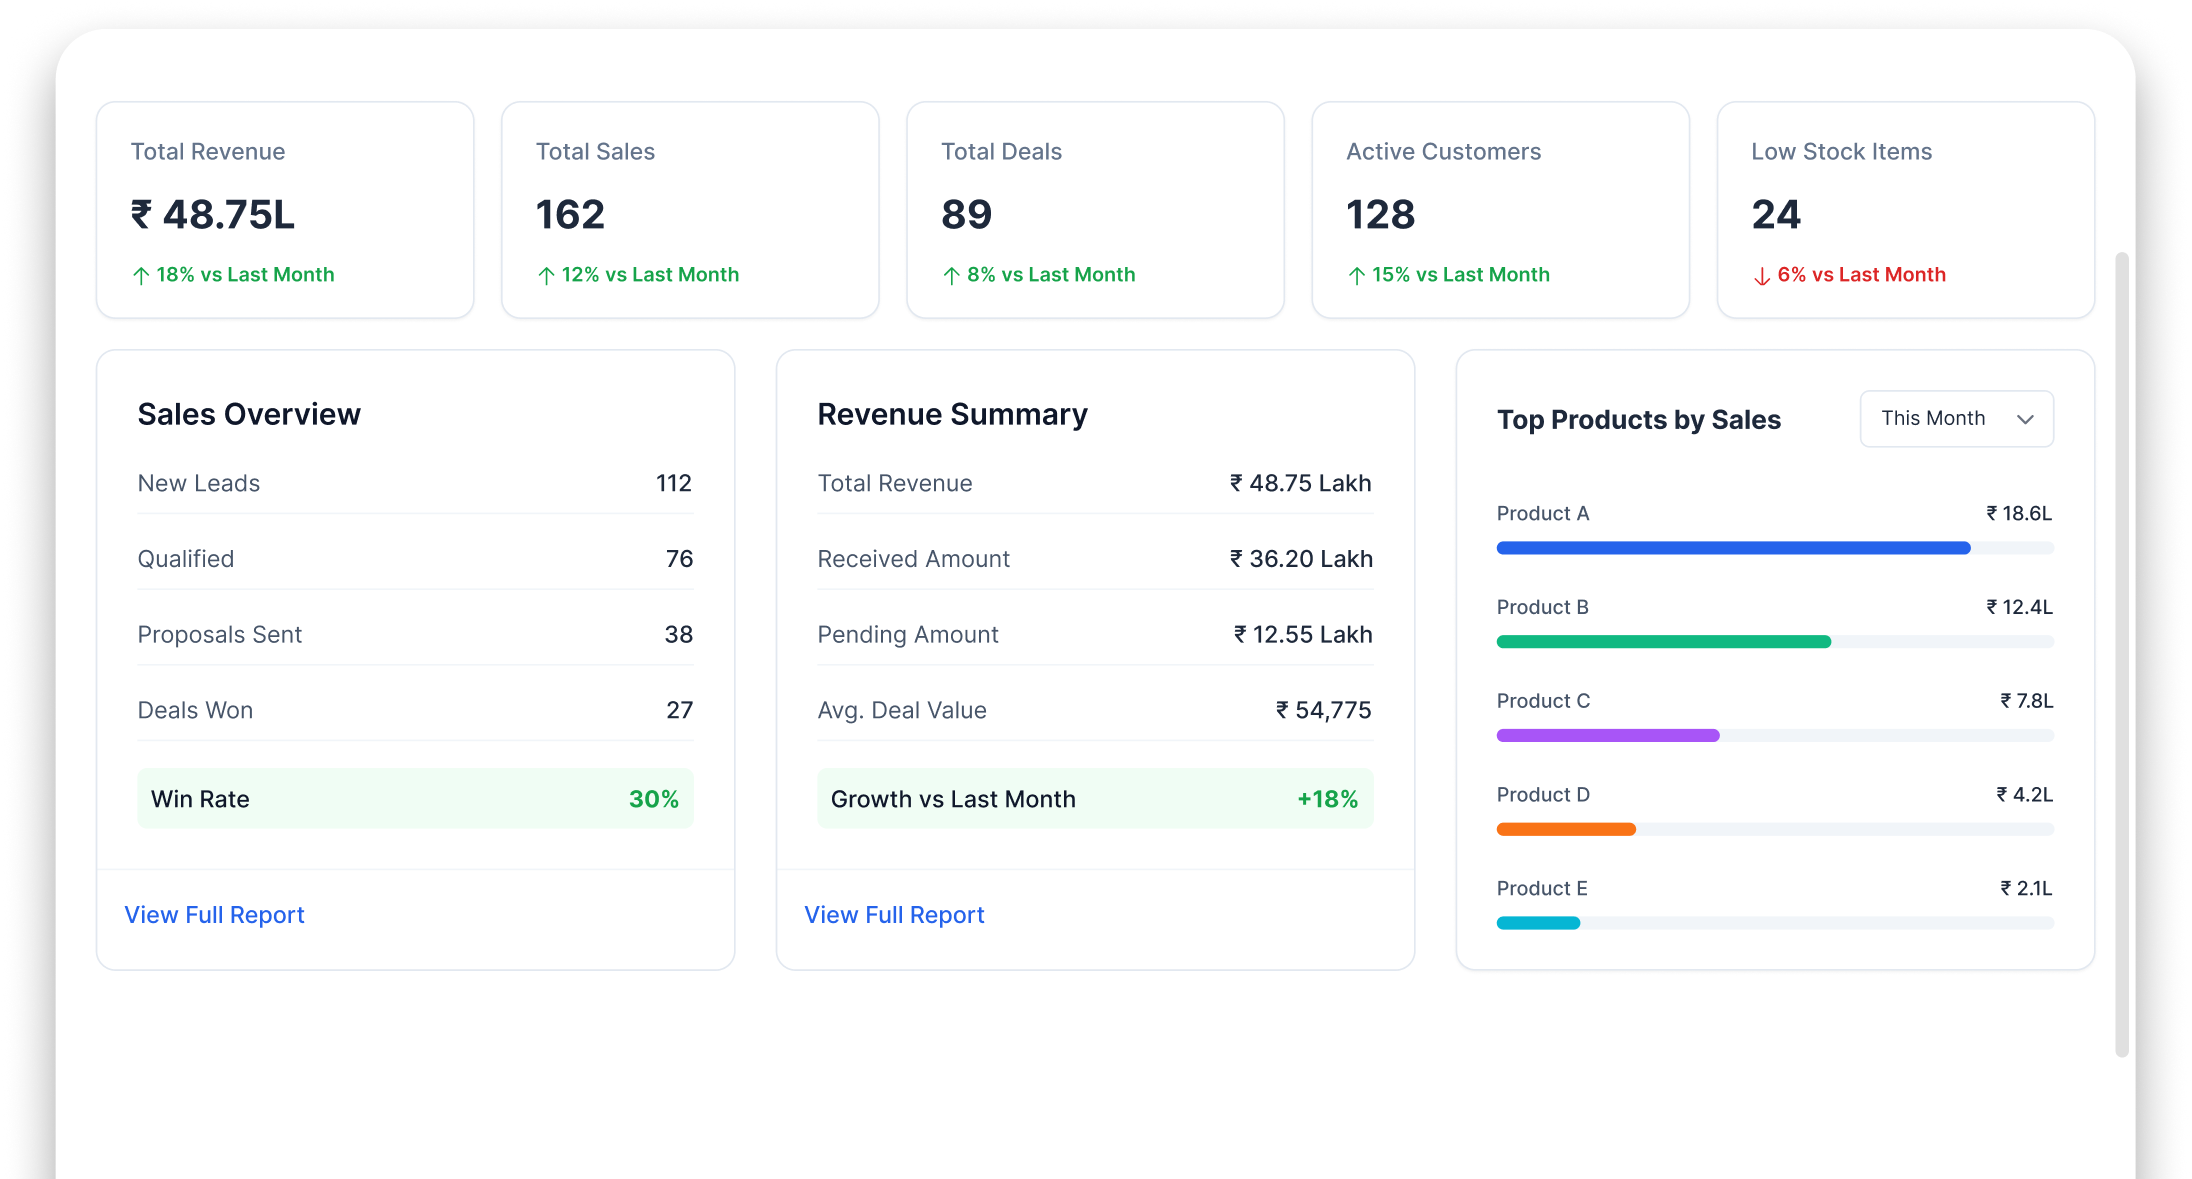
Real-time dashboards ready when you login no setup, no waiting
Pick Your View
Sales, inventory, tasks, team — switch between dashboards in one click
Drill Down
Click any number to see the data behind it from summary to detail
Export or Schedule
Download to Excel/PDF or schedule automated email delivery
Everything You Need to Analyze BUSINESS PERFORMANCE
Monitor performance, uncover trends, build custom reports, and share insights across your organization—all from a single platform.
Real-Time Dashboards
Live data across sales, inventory & tasks. No refresh needed
Pre-Built Reports
Ready-made reports for common needs sales summary, pipeline, stock, team performance
Custom Report Builder
Build your own reports with drag-and-drop. Choose metrics, filters, date ranges
Team Performance Analytics
Who’s hitting targets? Who needs coaching? Data per team member
Revenue & Trend Analysis
Revenue trends, growth patterns, seasonal analysis spot opportunities & risks
Scheduled Email Reports
Set reports to auto-email daily, weekly or monthly to stakeholders
THE RESULTS You'll See Every Day
Prevent proxy attendance, automate reporting, and maintain accurate attendance records across all locations
Decisions Based on Today’s Data
Not last week’s, not last month’s real-time numbers

Zero Manual Excel Work
No downloading, formatting, calculating. Dashboards are always ready

Spot Issues Before They Grow
Trends, dips & anomalies visible in real time act early

Automated Report Delivery
Stakeholders get reports in their inbox automatically no chasing

Powering WORKFLOWS
Across Modules




Complementary Features You May Need
Gain actionable insights from your sales pipeline, inventory, team productivity, and AI-powered business reports.

Sales Pipeline
Pipeline-specific analytics & forecasting

Stock Management
Inventory reports & valuation

AI Reports
AI-powered insights in plain English

Time Sheet
Time-based productivity reports
FAQ
Not at all. We intentionally designed our reports to be highly visual and simple to read. Instead of staring at infinite rows of intimidating numbers, you get clean charts, graphs, and percentage progress bars that tell you exactly how your business is doing at a glance.
Yes. Every business owner looks at success differently. You can pin the metrics that matter most to you-like daily sales, top-performing products, or pending deliveries-right to your main dashboard so they are the first thing you see when you log in.
Yes. If you like to review performance every Monday morning, you can set Wortal to automatically bundle your weekly sales or stock reports into a PDF and drop it straight into your email inbox every Monday at 8:00 AM.
Very easily. You can slice and dice your reports using filters. Want to see how much your North region team sold last Tuesday compared to this Tuesday? Or which product sold best in December? It takes just a few clicks to sort.
Yes, you can export any report or data table from Wortal into standard formats like Excel, CSV, or PDF with a single click. It makes sharing data with your external accountant or presenting numbers at a board meeting incredibly easy.
Real-Time Data. Smarter Decisions. Zero Excel
Free setup · No credit card · Cancel anytime